Every 15 minutes a computer reads a number of "one-wire" thermometers located at interesting places around the ranch. The most recent readings are reported here.
Clicking on the thermometer location link gives a plot of Temperature vs. Day for that thermometer over the past 4 days.
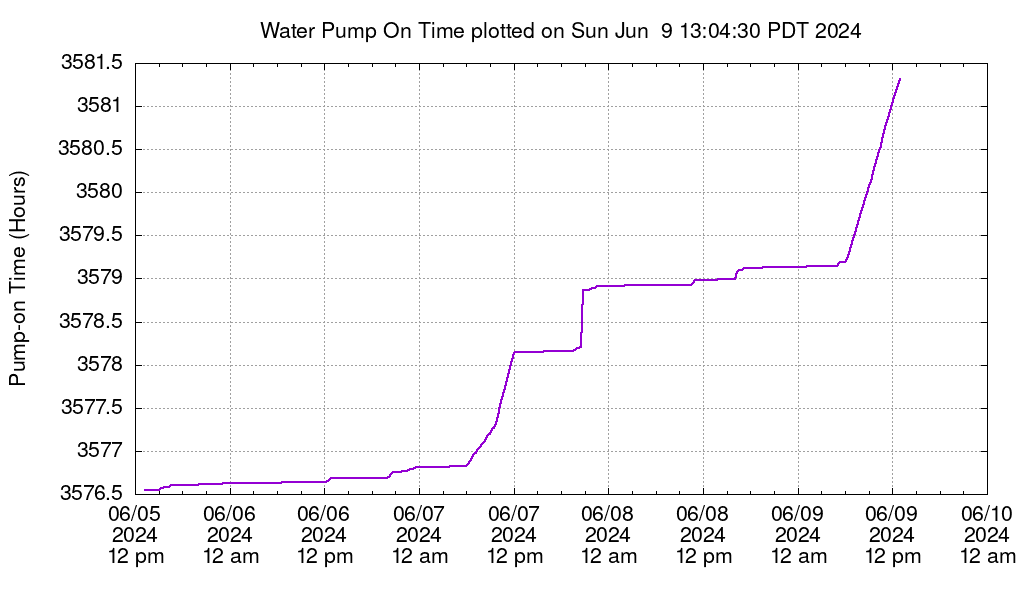
Set the number of days used for these temperature and water usage graphs here.
 1: Thermometer (id=10e2ae3501080039) reports T =  75.4 degrees F Master Bedroom
 2: Thermometer (id=1096b435010800bc) reports T =  61.9 degrees F Attic High East
 3: Thermometer (id=10f5ad35010800a9) reports T =  62.0 degrees F Attic High Center
 4: Thermometer (id=28e0e4140100006f) reports T =  69.5 degrees F Garage/Workshop
 5: Thermometer (id=28d8fd14010000ac) reports T =  73.2 degrees F Breezeway
 6: Thermometer (id=2897ef1401000002) reports T =  63.3 degrees F Front Porch Air
 7: Thermometer (id=1048b635010800e8) reports T =  75.4 degrees F Server Room Desk
 8: Thermometer (id=1018bf3501080035) reports T =  71.8 degrees F Server Room Floor
 9: Thermometer (id=10ecbe3501080056) reports T =  77.0 degrees F Server Room Ceiling
The Pumphouse air and sky thermometers were temporarily placed inside the new pumphouse on November 30, 2008 at 16:00 after installing the new pumphouse.
The attic fan was enabled on June 16, 2008 at 22:00.
The attic fan was disabled on July 9, 2008 at 22:46.
The attic fan was enabled on August 16, 2008 at 06:57.
The attic fan was disabled on August 16, 2008 at 22:24.
The attic fan was enabled on July 15, 2009 at 00:20.
The attic fan was disabled on July 19, 2009 at 04:53.
The attic fan was enabled on July 20, 2009 at 01:12.
The attic fan was disabled on September 29, 2009 at 11:16.
The attic fan was enabled on July 15, 2010 at 09:52.
The attic fan was disabled on September 9, 2010 at 08:22.
The attic fan was enabled on June 16, 2012 at about 15:00.
The attic fan was disabled on September 22, 2012 at 23:00.
The attic fan was enabled on July 1, 2013 at about 20:00.
"Pump Water" is measured on the pump water pipe just after it comes out of the well. There is insulation surrounding the thermometer and pipe so that this reading should be pretty close to the water temperature coming out of the well.
"Pumphouse Air" is the temperature of a 2" clean copper disk located about 4' above the ground. It is attached underneath a styrofoam block so that it should reliably give the air temperature and be insensitive to the sunlight and sky radiation. The pumphouse is about 100' from the ranch house.
"Pumphouse Sky" is the temperature of a 2" painted copper disk located on the upperside of the styrofoam block. The grayish-blue paint color is believed to be a good absorber of infrared radiation so that when this disk is not in direct sunlight, it gives an indication of the sky temperature. Even in the daytime, the sky is usually quite a bit cooler than the air. This arrangement will be improved before long.
"Garden Pond" thermometer is about 15 inches below the surface where the pond is 32 inches deep.
"30 inches Under Ground" is near the pump house, 100' north of the house. It is shaded by an oak tree most of the time.
The "Living Room" thermometer had been poorly placed and was cooled by leaky air from the attic. It was placed in the room air at 01:55 Nov 29, 2010, and then gave a reading consistent with other thermometers in the living room.
The "Back Patio" thermometer was moved up and away from the house a bit at 4 pm, December 9, 2010. The early morning winter sun was hitting it causing a spike in its reading. It is now 1 foot below the patio roof and 3 feet from the house.
The pumphouse thermometer and pump monitor are temporarily disconnected. I need to run a new, buried cable to the pumphouse. The one through trees was abrated by wind motion.
This graph shows the total time that the 3 kilowatt pump was operating vs. actual time for the past 4 days. For each hour the pump runs, 1344 gallons of water are pumped and 3 kW-hours of electricity are consumed. This data helps us quickly detect leaks in our ranch irrigation and animal water systems.
The pump black wire opened about 20 feet above the pump depth on Nov. 3, 2010, at 10 pm. It was repaired by 11 am November 5, 2010. The usage record contains a bogus 5 extra hours as a result of that failure.
September   22, 2007   0.2" (First rain since May)
December     7, 2007   1.3"
December    14, 2007   New grass appearing in fields!
December    18, 2007   1.8"
December    20, 2007   0.6"
December    29, 2007   0.3"
                 Subtotal:  4.2"
January    4-6, 2008   2.5"
January      7, 2008   0.1"
January  22-25, 2008   2.7" (with a tiny bit of snow)
January  26-27, 2008   1.0"
January  27-28, 2008   0.8"
Jaunary     31, 2008   0.3"
February   1-2, 2008   0.9"
February 20-21, 2008   1.4"
February 23-24, 2008   0.9"
May         25, 2008   0.2"
May      26-27, 2008   1.4"
  Total for 2007-8 season: 16.4"
October      4, 2008   0.2"
October     31, 2008   0.4"
November   1-2, 2008   1.5"
November     4, 2008   0.2"
November     8, 2008   0.8"
November 26-27, 2008   1.4"
December    13, 2008   0.2"
December    14, 2008   1.0"
December    21, 2008   1.1"
December    23, 2008   0.2"
December    25, 2008   0.8"
                 Subtotal:  7.8"
January      2, 2009   0.3"
January      4, 2009   0.3"
January  22-23, 2009   1.5"
January  23-24, 2009   1.8"
February   5-6, 2009   0.4"
February   8-9, 2009   0.7"
February    11, 2009   0.4"
February 15-17, 2009   1.6"
February 21-23, 2009   0.6"
March        1, 2009   0.4"
March        3, 2009   0.5"
March       22, 2009   1.2"
April        8, 2009   1.0"
May          1, 2009   0.9"
May	     3, 2009   0.2"
June         5, 2009   1.0"
  Total for 2008-9 season: 20.6"
September   14, 2009   0.1"
October  13-14, 2009   1.2"
October     19, 2009   0.1"
November    12, 2009   0.5"
December     7, 2009   0.7" (With a few snow flakes)
December     9, 2009   0.75"
December 12-13, 2009   1.25"
December 20-21, 2009   1.00"
December    26, 2009   0.35"
December    28, 2009   0.25"
                 Subtotal:  6.2"
January     12, 2010   0.75"
January     17, 2010   0.80"
January     18, 2010   0.65"
January     20, 2010   1.40"
January  21-23, 2010   0.80"
January     29, 2010   0.15"
February   4-5, 2010   0.60"
February   6-7, 2010   0.90"
February     9, 2010   0.50"
February    22, 2010   0.60"
February 23-24, 2010   1.15"
February 26-27, 2010   1.15" (again!)
March      2-3, 2010   1.70"
March       10, 2010   0.45"
March       12, 2010   0.85"
March       31, 2010   0.50"
April      4-5, 2010   1.00"
April       11, 2010   0.85"
April       12, 2010   0.95"
April       20, 2010   0.90"
April       21, 2010   0.55"
April       22, 2010   0.20"
April       28, 2010   0.50"
May          9, 2010   0.05"
  Total for 2009-2010 season: 24.15"
October      2, 2010   0.40"
October      4, 2010   0.50"
October  22-23, 2010   0.25"
October  24-25, 2010   0.70"
October  29-30, 2010   0.50"
November     7, 2010   1.10"
November 19-20, 2010   1.00"
November 20-21, 2010   1.15"
November 21-22, 2010   0.40"
November    23, 2010   0.75"
November    27, 2010   0.50"
December     3, 2010   0.15"
December     4, 2010   0.20"
December     5, 2010   0.65"
December   8-9, 2010   0.10"
December 14-15, 2010   0.50"
December 16-17, 2010   0.15"
December 17-18, 2010   0.90"
December 18-20, 2010   0.75"
December 21-22, 2010   1.25"
December 22-23, 2010   0.25"
December    25, 2010   1.00"  Big pond overflowing now
December 27-29, 2010   2.00"
                 Subtotal: 15.15"
Dec. 31-Jan. 2, 2011   1.85"
January    2-3, 2011   0.25"
January     30, 2011   0.65"
February    16, 2011   0.55"
February    17, 2011   1.05"
February 18-19, 2011   1.50"
February    20, 2011   0.35"
February 24-25, 2011   0.75"
March        1, 2011   0.15"
March        6, 2011   0.20"
March        7, 2011   0.30"
March        9, 2011   First snakes of Spring - 3 garter snakes mating in pond garden
March       14, 2011   0.10"
March       16, 2011   0.35"
March       18, 2011   0.65"
March    19-20, 2011   2.20"
March       22, 2011   0.20"
March       23, 2011   1.20"
March       24, 2011   1.30"
March       25, 2011   0.45"
March       26, 2011   0.25"
April        7, 2011   0.65"
May          6, 2011   First rattlesnake of season killed (near Magic's water trough)
May          9, 2011   0.20"  Walk loop path completed.
May         15, 2011   0.65"
May         17, 2011   0.50"
May         28, 2011   0.10"
May         31, 2011   2nd rattlesnake of season killed - near main gate
June         4, 2011   0.75"
June       5-6, 2011   2.10"
June        14, 2011   Big pond has stopped overflowing
June        29, 2011   1.05"
  Total for 2010-2011 season: 35.45"
July        30, 2011   3rd rattlesnake killed - on driveway just outside of main gate
July        31, 2011   0.01" Brief thunderstorm, 4th rattlesnake killed - outside of chicken coop door
September   21, 2011   5th rattlesnake killed - at gate to chicken yard
October      4, 2011   Big pond still has some water
October      5, 2011   0.90"
October      6, 2011   0.50"  Rain doubled water volume in big pond.
November   3-4, 2011   0.50"  Very little in big pond after rainfall.
November     6, 2011   0.40"
November    11, 2011   0.30"
November    19, 2011   0.65"
                 Subtotal:  3.25"
January  20-21, 2012   1.20"
January  22-23, 2012   0.80"
February    13, 2012   0.70"
February    15, 2012   0.55"
February    29, 2012   0.35"
March       14, 2012   Big pond has only a 3' mud puddle.
March    16-18, 2012   5.09"  Big pond now has about 9" of water, but no water flowing into it.
March    24-25, 2012   0.65"
March       26, 2012   0.45"  Badger seen near oak closest to chicken yard.
March       28, 2012   0.20"  Badger into McMurray's pen.
March       31, 2012   0.90"
April        1, 2012   0.35"
April       11, 2012   1.45"
April       12, 2012   0.70"
April       13, 2012   0.90"
April       14, 2012   0.35"
April       25, 2012   0.05"
April       26, 2012   0.35"
May          6, 2012   1st Rattlesnake of the season, 15", 1-button outside back breezeway door
May          8, 2012   1st 4 Mariposa Lillies seen.
June         4, 2012   0.50"
  Total for 2011-2012 season: 18.80"
July        20, 2012   36", 5-button Rattlesnake killed in chicken yard
September   22, 2012   30", 4-button Rattlesnake killed by hose at front of garage
October     22, 2012   0.50"
November   8-9, 2012   0.45"
November 16-17, 2012   0.75"
November 17-18, 2012   0.50"  New grass appearing in fields.
November    28, 2012   0.25"
November 29-30, 2012   0.85"
December   1-3, 2012   0.95"
December     5, 2012   0.10"
December    12, 2012   0.85"
December 17-18, 2012   0.70"
December 21-22, 2012   1.05"
December 23-24, 2012   1.25"
December 25-26, 2012   0.85"
December    27, 2012   0.50"
                 Subtotal:  9.55"
January    6-7, 2013   1.05"
January     10, 2013   0.25" with hail
January  24-25, 2013   0.45"
January     28, 2013          Big pond is still a small puddle about 10' across.
February     7, 2013   0.35"
Febuary     19, 2013   1.25" with a couple brief snow flurries
March        6, 2013   0.10"
March        7, 2013   0.10"
March       19, 2013   0.30"
March       31, 2013   0.60"
April        1, 2013   0.30"
April      3-4, 2013   0.45"
May        6-7, 2013   0.40"
May         14, 2013         2-button rattlesnake killed just outside entrance to vegetable garden
June         4, 2013         7-button rattlesnake (2.5' long, fat) killed outside garage near large pottery wheel.
  Total for 2012-2013 season: 15.15"
September   21, 2013   0.55"
September   27, 2013         6-button, 3-foot rattlesnake killed in **vegetable garden** which we had considered rattlesnake proof because of its walls.
October      9, 2013   0.25"
November    20, 2013   1.45"
December     3, 2013   0.45"
December     7, 2013   0.75" (fell as snow and melted, used wheelbarrow as gage with factor of 0.62 for funnel shape.)
                 Subtotal:  3.45"
January     30, 2014   1.25" Finally some rain again!!!!!!
February     6, 2014   0.70"
February     7, 2014   0.50"
February    10, 2014   0.30"
February    26, 2014   1.00"
February 28-29, 2014   0.85"
March        3, 2014   0.15"
March        6, 2014   0.40"
March    25-26, 2014   0.70"
March       29, 2014   0.75"
March       31, 2014   0.55"
April        1, 2014   0.95"
April       11, 2014         2-button rattlesnake seen in pond garden, killed the next day in same area.
April    25-26, 2014   1.75"
June         4, 2014         12-button rattlesnake killed inside house yard wall.
June         5, 2014         Two 3-1/2 foot long king snakes seen looking around inside house yard wall.
June       17?, 2014         12+-button, 3-1/2' long rattlesnake killed inside our screened vegetable garden
  Total for 2013-1014 season: 13.30"
September   28, 2014   0.70"
November     1, 2014   2.25"
November    13, 2014   0.45"
November    20, 2014   0.60"
November    23, 2014   0.20"
December     2, 2014   0.65"
December     4, 2014   0.30"
December 11-12, 2014   2.55"
December    15, 2014   0.70"
December 16-17, 2014   1.75"
December    19, 2014   0.15"
December    24, 2014         Two mountain lions spotted at a house 1/2 mile away.
                 Subtotal: 10.30"

January     27, 2015   0.50"
February     4, 2015         Brown-shoulder hawk seen eating a snake - in February!!!
February   6-7, 2015   1.45"
February   8-9, 2015   0.50"
February    22, 2015   0.50"
February    28, 2015   0.40"
March       11, 2015   0.15"
April        7, 2015   0.85"
April       24, 2015   0.20"
April       25, 2015   1.50"
May          7, 2015   0.15"
June        12, 2015          4-foot rattlesnake with 8+ buttons outside of west side of pond garden gate
June        24, 2015          4-foot, 2.0" dia rattlesnake with 16 buttons outside wall near car spot.  Cat alerted me to it.
  Total for 2014-2015 season: 16.50"
October      1, 2015   0.35"
October     28, 2015   0.45"
November   2-3, 2015   2.90"
November     9, 2015   0.80"
November    15, 2015   0.75"
November 24-25, 2015   0.75"
December    10, 2015   0.70"
December    11, 2015   0.45"
December    13, 2015   0.45"
December    19, 2015   0.85"
December 21-22, 2015   4.45"
December    24, 2015   0.55"
                 Subtotal: 13.45"
January      5, 2016   1.40"
January      6, 2016   1.75"
January      9, 2016   0.05"
January     13, 2016   0.05"
January     15, 2016   0.50"  Badger seen at SE corner of McMurray's Pen.
January     16, 2016   0.15"
January     18, 2016   1.75"
January     19. 2016   1.10"
January  22-23, 2016   1.30"
January     30, 2016   0.75"
January     31, 2016   1.15" Big pond still a mud puddle.
February    17, 2016   0.50"
March      3-4, 2016   1.20"
March      5-6, 2016   2.50"
March        7, 2016   1.40" Big pond starting to fill.
March    11-12, 2016   1.80" A small gopher snake was found near the gate by the breezeway.  It probably got flooded out of a garden hole and was very cold.  Marren took it to Aunt Maxine's garden.
March    13-14, 2016   1.45" Big pond overflowing
March       21, 2016   0.20"
April      8-9, 2016   4.40"
April       19, 2016         Cleaned out septic pipe
April       22, 2016   0.65"
June        12, 2016   0.35"
June        13, 2016         3', 6-button rattlesnake seen midway along Shadow's south fence.  Went down squirrel hole.
June        25, 2016         Big pond about 3' below overflow
June        26, 2016         Cleaned out septic pipe again
  Total for 2015-2016 season: 37.90"
July        31, 2016         Cleaned out septic pipe again
August       7, 2016         Cleaned out septic pipe
August      14, 2016         Rattlesnake in parking area at 2 am, 4' long, 13 buttons, not so fat
September    9, 2016         Turtle pond level 7.5 cm below top of flagstone at 10:13
October     11, 2016         Cleaned out septic pipe
October     16, 2016   0.30"
October     17, 2016   0.50"
October     22, 2016         Thunder and a few drops, but no significant collection.
October  27-28, 2016   1.20"
October     30, 2016   0.15"
Oct. 31-Nov. 1, 2016   0.50"
November    20, 2016   0.65"
November    23. 2016   0.05"
November 26-27, 2016   1.95"
November    28, 2016   0.05"
December     5, 2016   1.05"
December  8-10, 2016   2.30"
December 15-16, 2016   3.10"
December    18, 2016         Big pond is a small 6" deep puddle
December    23, 2016   1.10"
December    31, 2016   0.40"
                 Subtotal: 13.30"
January    3-5, 2017   2.80"
January    6-7, 2017   1.60"
January      8, 2017   1.05"
January      9, 2017   0.65" Big pond has maybe 1 foot of water and is connected.
January  10-11, 2017   2.30"
January  11-12, 2017   3.25" Big pond is overflowing.  Wheelbarrow emptied.
January  18-20, 2017   3.25"
Jnuary   22-23, 2017   2.40" Big pond is vigorously overflowing in 3 paths.
January     24, 2017         Water level in wheelbarrow at noon = 15.2 cm
January     30, 2017         Water level in wheelbarrow at 5 pm = 14.7 cm
February   2-3, 2017   1.90"
February     5, 2017         Water level in wheelbarrow at 13:40 = 18.4 cm (downpour on Feb 3 and sunny on Feb 4)
February  7-10, 2017   6.90"
February    16, 2017   1.90"
February    20, 2017   1.30"
February    21, 2017   1.25"
March        5, 2017   0.45"
March       21, 2017   0.30"
March       24, 2017   0.70"
March       26, 2017   0.25"
April      6-7, 2017   1.15"
April        8, 2017   0.15"
April       13, 2017   1.00"
April       16, 2017   0.15"
April       18, 2017   0.65"
May          7, 2017   0.10"
May         29, 2017         5-1/2' gopher snake at front porch - relocated to near pump house
June         7, 2017         1 button rattlesnake between the greenhouses about 1' 3" long, but rather fat.
June        11, 2017   0.85" Serious thunderstorm
June        30, 2017         4' long, 1.75" dia 13+6? button rattlesnake killed in backyard outside kitchen.
  Total for 2016-2017 season: 49.60"
September   11, 2017   0.45" Thunderstorm
September   12, 2017         Cleared Septic
September   21, 2017   0.65"
October     19, 2017   0.35"
November 16-17, 2017   0.80"
November    27, 2017   1.20"
                 Subtotal:  3.45"
January      4, 2018   0.25"
January      6. 2018   1.20"
January      8, 2018   0.10"
January      9, 2018   1.65"
January     19, 2018   0.60"
January     22, 2018         Cleared Septic - Problem seemed to be in the tank, not pipe.
January     25, 2018   0.60"
February     1, 2018         Small Gopher snake seen near mailbox.
February     9, 2018         1st Gopher snake of season seen in garden (about 3' long)
February    22, 2018   0.25"
February 26-27, 2018   0.35"
March      1-3, 2018   4.95"
March    10-12, 2018   1.15"
March       16, 2018   0.85"
March    20-22, 2018   4.35"
April      5-7, 2018   1.65"
April    15-16, 2018   0.70"
April       24, 2018         1-button, 1' long rattlesnake by car parts cabinet
May         25, 2018   0.20"
  Total for 2017-2018 season: 22.30"
July         1, 2018         Cleared Septic
September   14, 2018	     Cleared Septic
October      2, 2018   0.05"
October      3, 2018   2.25"
October      4, 2018   0.75"
October     11, 2018         Cleared Septic
November 21-22, 2018   2.00" Cleared Septic also
November 23-24, 2018   1.30"
November 27-29, 2018   3.90"
November    29, 2018   1.50"
Novem 30-Dec 1, 2018   1.95"
December   5-6, 2018   0.45"
December 16-17, 2018   1.20"
December    23, 2018   0.70"
                 Subtotal: 16.05"
January      3, 2019         Cleared Septic
January      5, 2019   0.60"
January      6, 2019   1.20"
January      9, 2019   0.50"
January  12-18, 2019   3.10"
January     31, 2019   0.05"
February     1, 2019   1.25"
February   2-3, 2019   3.10"
February   4-5, 2019   2.55"
February  9-10, 2019   1.35"
February 13-15, 2019   1.80"
February 16-17, 2019   1.65"
February    21, 2019   0.20"
February    27, 2019   0.25"
February    28, 2019   0.20"
March      2-3, 2019   1.15"
March        4, 2019   0.50"
March        5, 2019   0.80"
March        7, 2019   0.45"
March     9-10, 2019   0.50"
March       12, 2019   0.35"
March       19, 2019   0.45"
March    22-24, 2019   0.50"
March    26-28, 2019   1.45"
April      1-2, 2019   0.25"
April    15-16, 2019   0.35"
May          9, 2019   0.05"
May         15, 2019         Cleared out septic pipe
May      15-16, 2019   1.40"
May      18-19, 2019   1.95"
May      22-23, 2019   0.30"
May      26-27, 2019   0.80"
June         5, 2019         Rattlesnake (3 buttons) killed in parking area.
June        16, 2019         Cleared out septic pipe (before totally backed up)
  Total for 2018-2019 season: 45.10"
November 26-27, 2019   0.85"
Nov. 30-Dec. 1, 2019   2.70"
December   3-4, 2019   0.75"
December   7-8, 2019   2.25"
December    13, 2019   0.30"
December 22-24, 2019   1.45"
December    27, 2019   0.05"
                 Subtotal:  8.35"
January     16, 2020   1.00"
January     26, 2020   0.15"
March       10, 2020   0.30"
March    15-16, 2020   3.00"
March       22, 2020   1.25"
March    23-24, 2020   0.60" Gopher snake accidentally killed weed-eating Pond Garden
April        2, 2020         Another gopher snake relocated from the front porch.
April        4, 2020   0.45"
April        5, 2020   2.05"
April        9, 2020   1.10"
April       19, 2020   0.30"
May      17-19, 2020   1.75" not dumped
  Total for 2019-2020 season: 20.30"
September    8, 2020         Cleaned septic pipe
December 11-12, 2020   1.00"
December 13-14, 2020   0.70"
December    17, 2020   0.65"
December    30, 2020   0.10"
                 Subtotal:  2.45"
January     23, 2021   0.25"
January  24-25, 2021   1.10"
January  26-28, 2021   4.70"
January     29, 2021   1.95"
February    12, 2021   0.90"
February    13, 2021   0.30"
March        9, 2021   0.95"
March       11, 2021   0.85"
March       19, 2021   0.90"
April       22, 2021         3.5' rattlesnake w/7 rattles killed
April       25, 2021   0.45"
May         29, 2021         Baby rattlesnake in NE corner of vegetable garden
June         4, 2021         3' rattlesnake w/5 rattles
June         4, 2021         1-1/2' rattlesnake w/3 rattles at breezeway door
June        14, 2021         5' gopher snake at NE corner of pond garden
June        14, 2021         1-button rattlesnake at base of olive tree in front yard
June        29, 2021         3-button rattlesnake, 2'-long, in driveway in front of tack room patio
  Total for 2020-2021 season: 14.80"
August      30, 2021         Cleaned out septic pipe
October      7, 2021   0.10"
October     25, 2021   2.85"
October     30, 2021         Cleaned septic.  Problem was apparently at the junction of the kitchen pipe and porch bathroom toilet.
November     9, 2021   1.00"
December     9, 2021   0.95"
December 13-14, 2021   2.65"
December    16, 2021   0.75"
December 22-23, 2021   2.10"
December 25-26, 2021   1.80"
December 27-28, 2021   0.30"
                 Subtotal:  9.00"
March        4, 2022   0.40"
March       28, 2022   0.75"
April        3, 2022	     20"-long gopher snake seen on driveway near pond garden entrance
April        8, 2022         40"-long gopher snake seen at front patio gate
April    11-12, 2022   0.75"
April       16, 2022   0.25"
April        7, 2022         60"-long gopher snake seen inside wall at kitchen window.  Moved to hole near septic tank.
May         13, 2022         4-1/2', 2.5" diameter rattlesnake with eggs inside killed on the ramp to the pad between the barns.
June        24, 2022         3'6"-long, 1.2" diameter, 9-button rattlesnake killed in pond garden next to house wall.
  Total for 2020-2021 season: 11.15"
September 19-20, 2022  1.10"
November     1, 2022   0.60"
November     3, 2022   0.05"
November  8-10, 2022   3.10"
December   1-2, 2022   1.60"
December   3-4, 2022   2.15"
December  9-11, 2022   2.30"
December 26-28, 2022   2.95"
December  29-1, 2022   3.80"
                 Subtotal:  17.65"
January    3-6, 2023   1.85"
January    7-9, 2023   3.40"
January   9-11, 2023   2.70"
January  14-15, 2023   1.75"
January  15-16, 2023   1.70"
January     19, 2023   0.30"
January     29, 2023   0.55"
February   4-6, 2023   0.90"
February    22, 2023   0.10"
February 23-24, 2023   3.75"
February 28-29, 2023   2.55"
March      4-5, 2023   1.50"
March     9-10, 2023   2.50"
March       12, 2023   0.30"
March    14-15, 2023   1.60"
March       19, 2023   0.40"
March    20-22, 2023   1.00"
March    28-30, 2023   2.35"
July         3, 2023         2', 1-buttom rattlesnake killed at west fence of pond garden under the wisteria.
  Total for 2022-2023 Season: 46.85"
November    15, 2023   0.05"
November    18, 2023   1.00"
December 18-19, 2023   1.45"
December    30, 2023   0.35"
                 Subtotal:  2.85"
January      3, 2024   1.05"
January      7, 2024   0.60"
January  16-17, 2024   0.80"
January  20-22, 2024   2.30"
January     24, 2024   0.45"
Jan 31-Feb 5,   2024   4.60"
January    7-8, 2024   1.50"
January  14-15, 2024   1.85"
January  18-19, 2024   1.50"
January  20-21, 2024   0.85"
March      1-4, 2024   2.00"
March       11, 2024   0.25"
March    23-24, 2024   1.65"
March       30, 2024   1.10"
April      4-5, 2024   1.20"
April    13-14, 2024   1.75"
May          4. 2024   1.05"
  Total for 2023-2024 Season:27.35"
PHP code or plotting scripts last updated: May 5, 2024

![]()